 How-to
Trading Strategies for Simulated Funded Accounts
Table of Contents
- How Simulated Funded Accounts Differ From Live Trading
- Build a Prop Firm Evaluation Trading Plan Before You Place a Trade
- Position Sizing for Prop Trading: The Math That Keeps You Funded
- A Daily Loss Limit Strategy That Protects Your Evaluation
- Backtest and Forward-Test Every Strategy Before You Trade It
- Funded Account Trading Plan Template: What to Track Daily
- Common Mistakes That Fail Simulated Funded Accounts
- Frequently Asked Questions
Last Updated: October 14, 2026
How Simulated Funded Accounts Differ From Live Trading
A simulated funded account is a notional trading account where you trade real market prices but no real capital changes hands until you pass an evaluation and qualify for payouts.
At Duncan Funded, we built our evaluation programs around this reality.
The key differences:
- No slippage or partial fills in most simulations, so execution feels cleaner than live markets
- Hard rule enforcement on drawdown, position size, and daily loss limits
- Profit targets tied to a fixed time window rather than open-ended compounding
The CFTC's guidance on retail trading makes clear that simulated results do not guarantee live performance. That gap is where most traders get caught.
Most guides treat simulated funded accounts like a demo. They are not. A demo teaches you the platform; an evaluation tests whether you can follow a plan under pressure.
Build a Prop Firm Evaluation Trading Plan Before You Place a Trade
A prop firm evaluation trading plan is a written document defining your entries, exits, risk per trade, and daily stop before you open your first position. Without one, you are gambling with rules attached. What separates a passing plan from a failing one:
- It names specific setups, not "good opportunities"
- It sets a hard risk-per-trade number
- It defines when you stop for the day
The SEC's investor education on trading plans stresses that written rules reduce emotional decisions. That advice applies double in an evaluation, where one bad day ends the account.
Core Sections of a Written Evaluation Plan
Every plan needs six parts:
- Market focus - which instruments you trade and why
- Setup criteria - the exact conditions that trigger a trade
- Entry rules - price, time, and confirmation required
- Exit rules - stop-loss and take-profit placement
- Risk per trade - a fixed dollar or percentage amount
- Daily and total loss limits - the line you never cross
Write it in one page. If it takes three pages, you will not follow it at 9:30 a.m.
Position Sizing for Prop Trading: The Math That Keeps You Funded
Position sizing for prop trading is calculating how many contracts or lots to trade so a losing trade costs a fixed, pre-decided amount. Get this wrong and nothing else matters. The base formula:
Position size = (Account size x Risk per trade %) / (Stop distance x Value per point)
Three inputs. No guesswork.
- Account size: your simulated balance
- Risk per trade: usually 0.5% to 1%
- Stop distance: how far price can move against you before you exit
Worked Example: 1% Risk on a $100,000 Simulated Account
On a $100,000 simulated account risking 1% per trade, $1,000, with a stop 20 points away and each point worth $5:
- Risk per contract = 20 x $5 = $100
- Contracts to trade = $1,000 / $100 = 10 contracts
Change the stop to 50 points: risk per contract becomes $250, and you trade just 4 contracts. Same dollar risk, different position. Most failed evaluations come from sizing by feel, 10 contracts on a tight stop, 10 on a wide one, where the second trade risks five times more.
Adapting Size to the Rule You Are Actually Trading Under
The formula above assumes one risk limit, but real evaluations stack several. Run every trade through all three checks and take the smallest result.
**1.
2. Trailing drawdown. A trailing limit follows your equity high, so a winner tightens your remaining room. Start with a $6,000 trailing drawdown, go up $3,000, and your floor rises with your peak.
3. Consistency rule. Many evaluations cap any single day's profit at 30% to 40% of total profit.
A Trade Log That Shows the Math Working
Abstract formulas hide mistakes; a short log exposes them. Three trades on a $100,000 simulated account, sized correctly versus by feel:
| Trade | Stop (points) | Value/point | Risk/contract | Contracts (1% = $1,000) | Actual risk |
|---|---|---|---|---|---|
| A | 20 | $5 | $100 | 10 | $1,000 |
| B | 50 | $5 | $250 | 4 | $1,000 |
| C | 35 | $5 | $175 | 5 | $875 |
Trade C rounds down to 5 contracts because 5.7 is not tradeable in whole units. Rounding down keeps risk under the cap; rounding up to 6 would push risk to $1,050 and break the 1% rule.
Now the same three trades sized by feel at a flat 10 contracts each:
| Trade | Contracts | Risk/contract | Actual risk |
|---|---|---|---|
| A | 10 | $100 | $1,000 |
| B | 10 | $250 | $2,500 |
| C | 10 | $175 | $1,750 |
Trade B alone risks 2.5% of the account. Two of those in a session and the daily limit is gone. The formula is the difference between a controlled loss and a blown evaluation.
Where Sizing Meets Execution
Simulated fills are usually cleaner than live ones: spreads widen, slippage appears, and a stop can fill several points past your level in fast markets. If your sizing assumes a perfect fill, add a buffer, many practitioners size as if the stop were 10% to 20% wider than planned, keeping dollar risk inside the cap.
A Daily Loss Limit Strategy That Protects Your Evaluation
A daily loss limit strategy caps how much you can lose in one session and forces you to stop once you hit it, the single most effective tool for surviving a funded challenge. Set it at half your maximum daily drawdown: if the firm allows a 5% daily loss, stop at 2.5%. Drawdown rules are usually measured on equity including open positions, so a trade that looks fine at 2% can hit 5% in seconds during a news spike.
Your daily loss limit strategy should include:
- A dollar figure you will not exceed
- A time of day you stop trading regardless of P&L
- A rule against "revenge trades" after two losses
Backtest and Forward-Test Every Strategy Before You Trade It
Backtesting tests a strategy on past data; forward testing runs it on live data with no real money. You need both before risking an evaluation, but "I backtested it" means nothing without a defined protocol. Here is a repeatable one.
The Protocol, Step by Step
- Freeze the rules in writing. No discretion, no "I would have known." If a rule cannot be stated as an if-then condition, it is not testable.
- Pick a sample window covering more than one regime. Include at least one trending stretch, one range-bound stretch, and one high-volatility event.
- Backtest a minimum of 100 trades. Below 100, results are noise, a 60% win rate over 20 trades can easily be a 45% strategy that got lucky.
- Log every trade with date, instrument, entry, exit, size, stop, result in dollars, and result in R (multiples of risk).
- Forward-test 20 to 30 trades on a simulated account using the same rules, instruments, and session times.
- Compare the two sets. If forward results fall outside the range your backtest predicted, the strategy is not ready.
- Accept, adjust, or discard using the thresholds below, decided before you look at the results.
Why Sample Size Is the Whole Game
Small samples lie, and they lie in the direction you want to believe. The margin of error on a win rate shrinks with the square root of the sample: 100 trades gives an estimate accurate to about plus or minus 10 percentage points; 400 trades tightens that to about 5. A practical rule: if removing your five best trades turns a profitable strategy into a losing one, you do not have an edge, you have five lucky trades.
Pass/Fail Thresholds You Decide in Advance
Set these before testing so you cannot rationalize a bad result after the fact.
| Metric | Minimum to Trust | Pass | Fail |
|---|---|---|---|
| Sample size | 100 trades | 100+ trades | Under 50 |
| Win rate | 40% | 45-60% | Under 35% |
| Profit factor | 1.2 | 1.5+ | Under 1.1 |
| Average risk-to-reward | 1.0 | 1.5+ | Under 1.0 |
| Max drawdown | Within rules | Under half the limit | At or over limit |
| Expectancy | Positive | Positive after costs | Negative |
Expectancy ties it together: (win rate x average win) minus (loss rate x average loss). A 40% win rate with 2:1 reward-to-risk is positive, 0.4 x 2 minus 0.6 x 1 = +0.2R per trade. A 60% win rate with 0.5:1 reward-to-risk is negative, 0.6 x 0.5 minus 0.4 x 1 = -0.1R.
Worked Example: Reading the Results
Suppose your backtest of 120 trades produces: 52 wins, 68 losses, average win $420, average loss $260.
- Win rate = 52 / 120 = 43.3%
- Profit factor = (52 x $420) / (68 x $260) = $21,840 / $17,680 = 1.24
- Expectancy = (0.433 x $420) - (0.567 x $260) = $181.86 - $147.42 = +$34.44 per trade
Profit factor of 1.24 clears the minimum but sits below the 1.5 pass line. Expectancy is positive, so the strategy is tradeable, but only with tight rule adherence, because the margin is thin. Forward-test it: a profit factor of 0.9 means discard; near 1.2 means the backtest held up.
What Backtests Cannot Tell You
A backtest is a simulation of a simulation. It cannot capture spread widening at the open, a stop filling past your level, a platform freeze during a news release, or a rule forbidding holds through an economic event. Treat it as a filter, not a guarantee, the forward test on a simulated account is where execution reality shows up and most strategies quietly fail.
Funded Account Trading Plan Template: What to Track Daily
A funded account trading plan template is a daily log recording what you traded, why, and how it went, turning vague feelings into data you can act on.
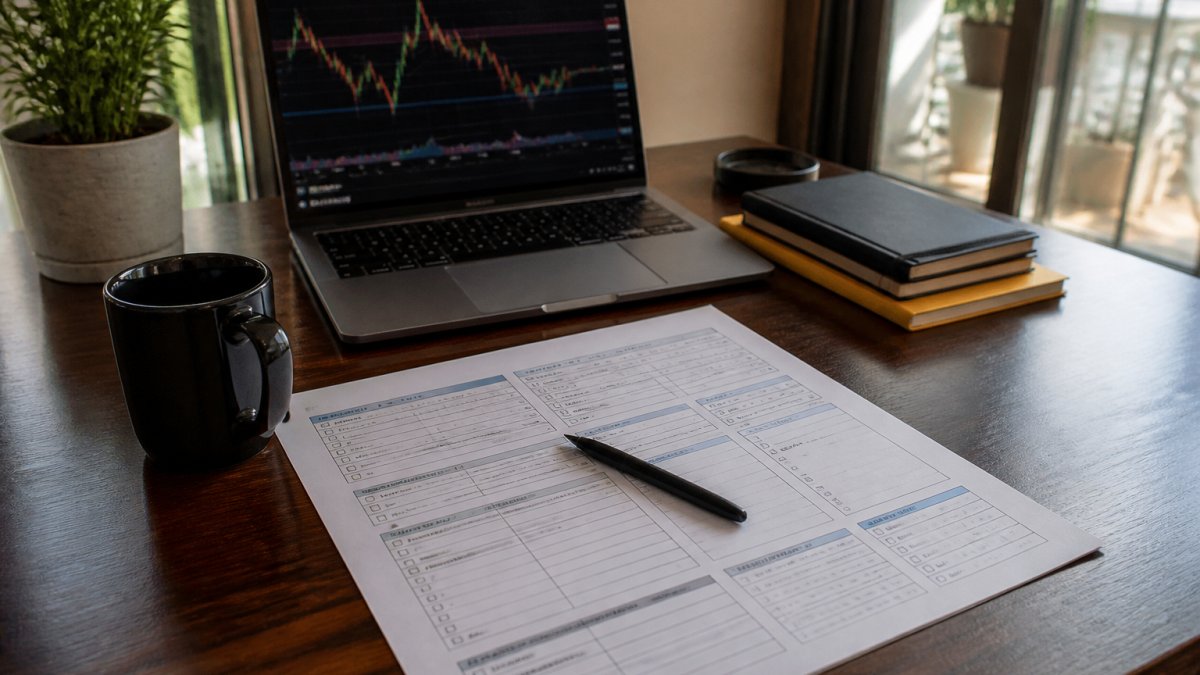
Track these fields every session:
- Date and market conditions
- Setups taken and skipped
- Entry, exit, and position size
The FINRA's investor insights on recordkeeping notes that traders who log decisions spot patterns faster than those who rely on memory.
Review the log every Friday. Look for one thing: which rule did you break most often? Fix that one thing next week.
Common Mistakes That Fail Simulated Funded Accounts
The biggest mistake is treating the evaluation as a sprint: most traders try to hit the profit target in week one, then blow the account on day eight.
Other common failures:
- Overtrading - taking setups that do not meet criteria
- Ignoring the daily loss limit - one bad session ends the account
- Sizing by conviction, not math - the "high confidence" trade is the one that hurts
Discipline beats edge in an evaluation. A mediocre strategy followed strictly passes more often than a great strategy followed loosely.
That is why we built Duncan Funded around transparent rules and no hidden conditions. Our programs span Forex, Futures, Crypto, and Equities so you can run the strategy you actually trade. We are certified by The Financial Commission and powered by FPFX technology, and our founder, Tommy Duncan, is a retired U.S. Army Colonel. Precision is not a marketing line here. It is the standard.
Passing a simulated evaluation is not about being right more often.
Duncan Funded gives disciplined traders a clear path to prove it: structured simulated evaluations across four asset classes, transparent rules with no hidden conditions, and access to notionally funded accounts when you pass.
Frequently Asked Questions
What is the most effective trading strategy for a simulated funded account?
There is no single best strategy, but the most effective approach for simulated funded accounts is one that matches the evaluation rules and your testing data. Start with a clear prop firm evaluation trading plan that defines entry and exit rules, position sizing, and daily loss limits. Backtest the strategy over at least 100 trades, then forward-test it on a demo for 20 to 30 sessions. A simple trend-following or swing trading approach with a risk-to-reward ratio of at least 1:2 often works well because it limits trade frequency and keeps drawdown predictable. The strategy must be repeatable, not improvised.
How should you manage risk in a simulated funded account?
Risk management in a simulated funded account starts with position sizing for prop trading. Risk no more than 0.5% to 1% of the account balance per trade. Set a daily loss limit, often 2% to 3% of the account, and stop trading when you hit it. Also monitor overall maximum drawdown, which many evaluations cap at 6% to 10%. Use stop-loss orders on every trade and avoid correlating positions that could compound losses. The goal is capital preservation first, profit target second.
How many trades should you take each day during an evaluation?
Trade frequency depends on your strategy, but most successful evaluations avoid overtrading. A typical range is one to three trades per day. If your strategy generates more signals, check whether they meet your entry rules or if you are forcing trades. Day trading can work if you have a tested edge, but swing trading often reduces noise and emotional pressure. Track your trade frequency in your funded account trading plan template and review it weekly. If win rate drops as frequency rises, cut back.
Should you use the same strategy in a simulated funded account as in a personal account?
You can use a similar strategy, but you must adapt it to the evaluation rules. Simulated funded accounts have strict daily drawdown and maximum drawdown limits that a personal account may not have. Reduce your risk per trade and set a hard daily loss limit. If your personal strategy uses wide stops or holds through news events, adjust those habits. The core edge can stay the same, but position sizing and exit rules should be tightened to comply with the funded account rules. Always backtest the adapted version first.